¶ Performance Metrics and Charts
¶ Quick Summary
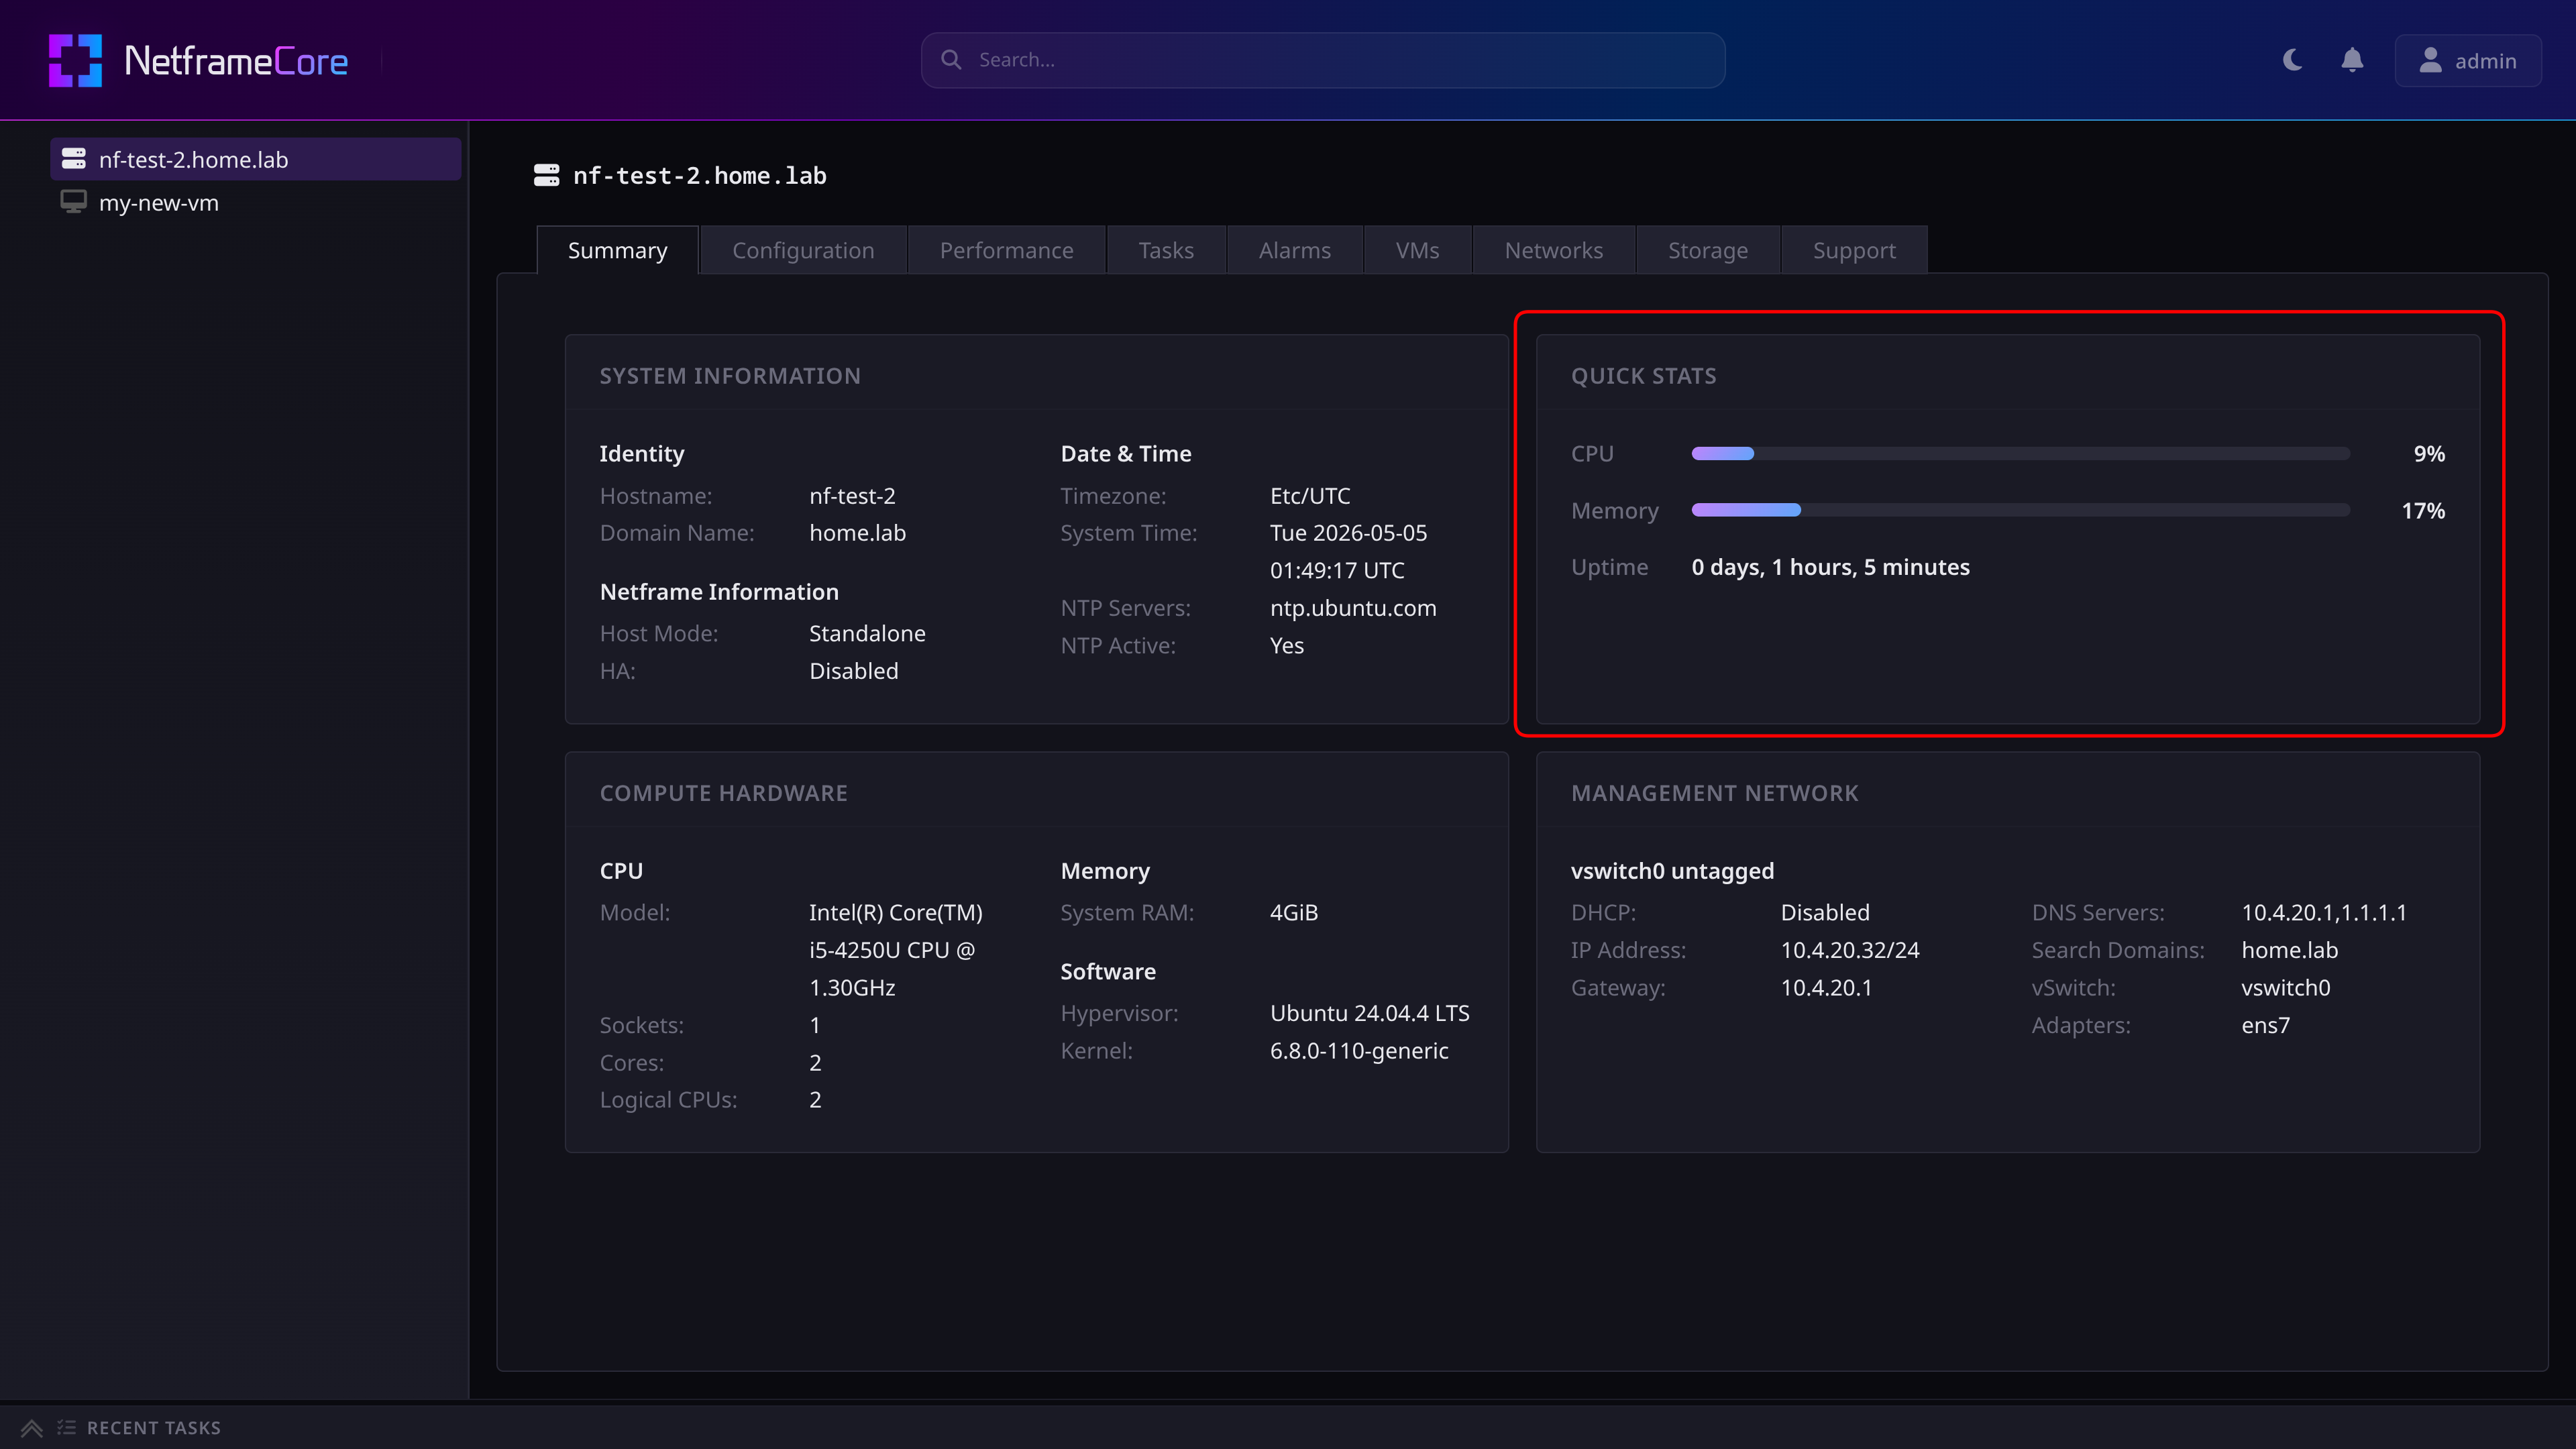
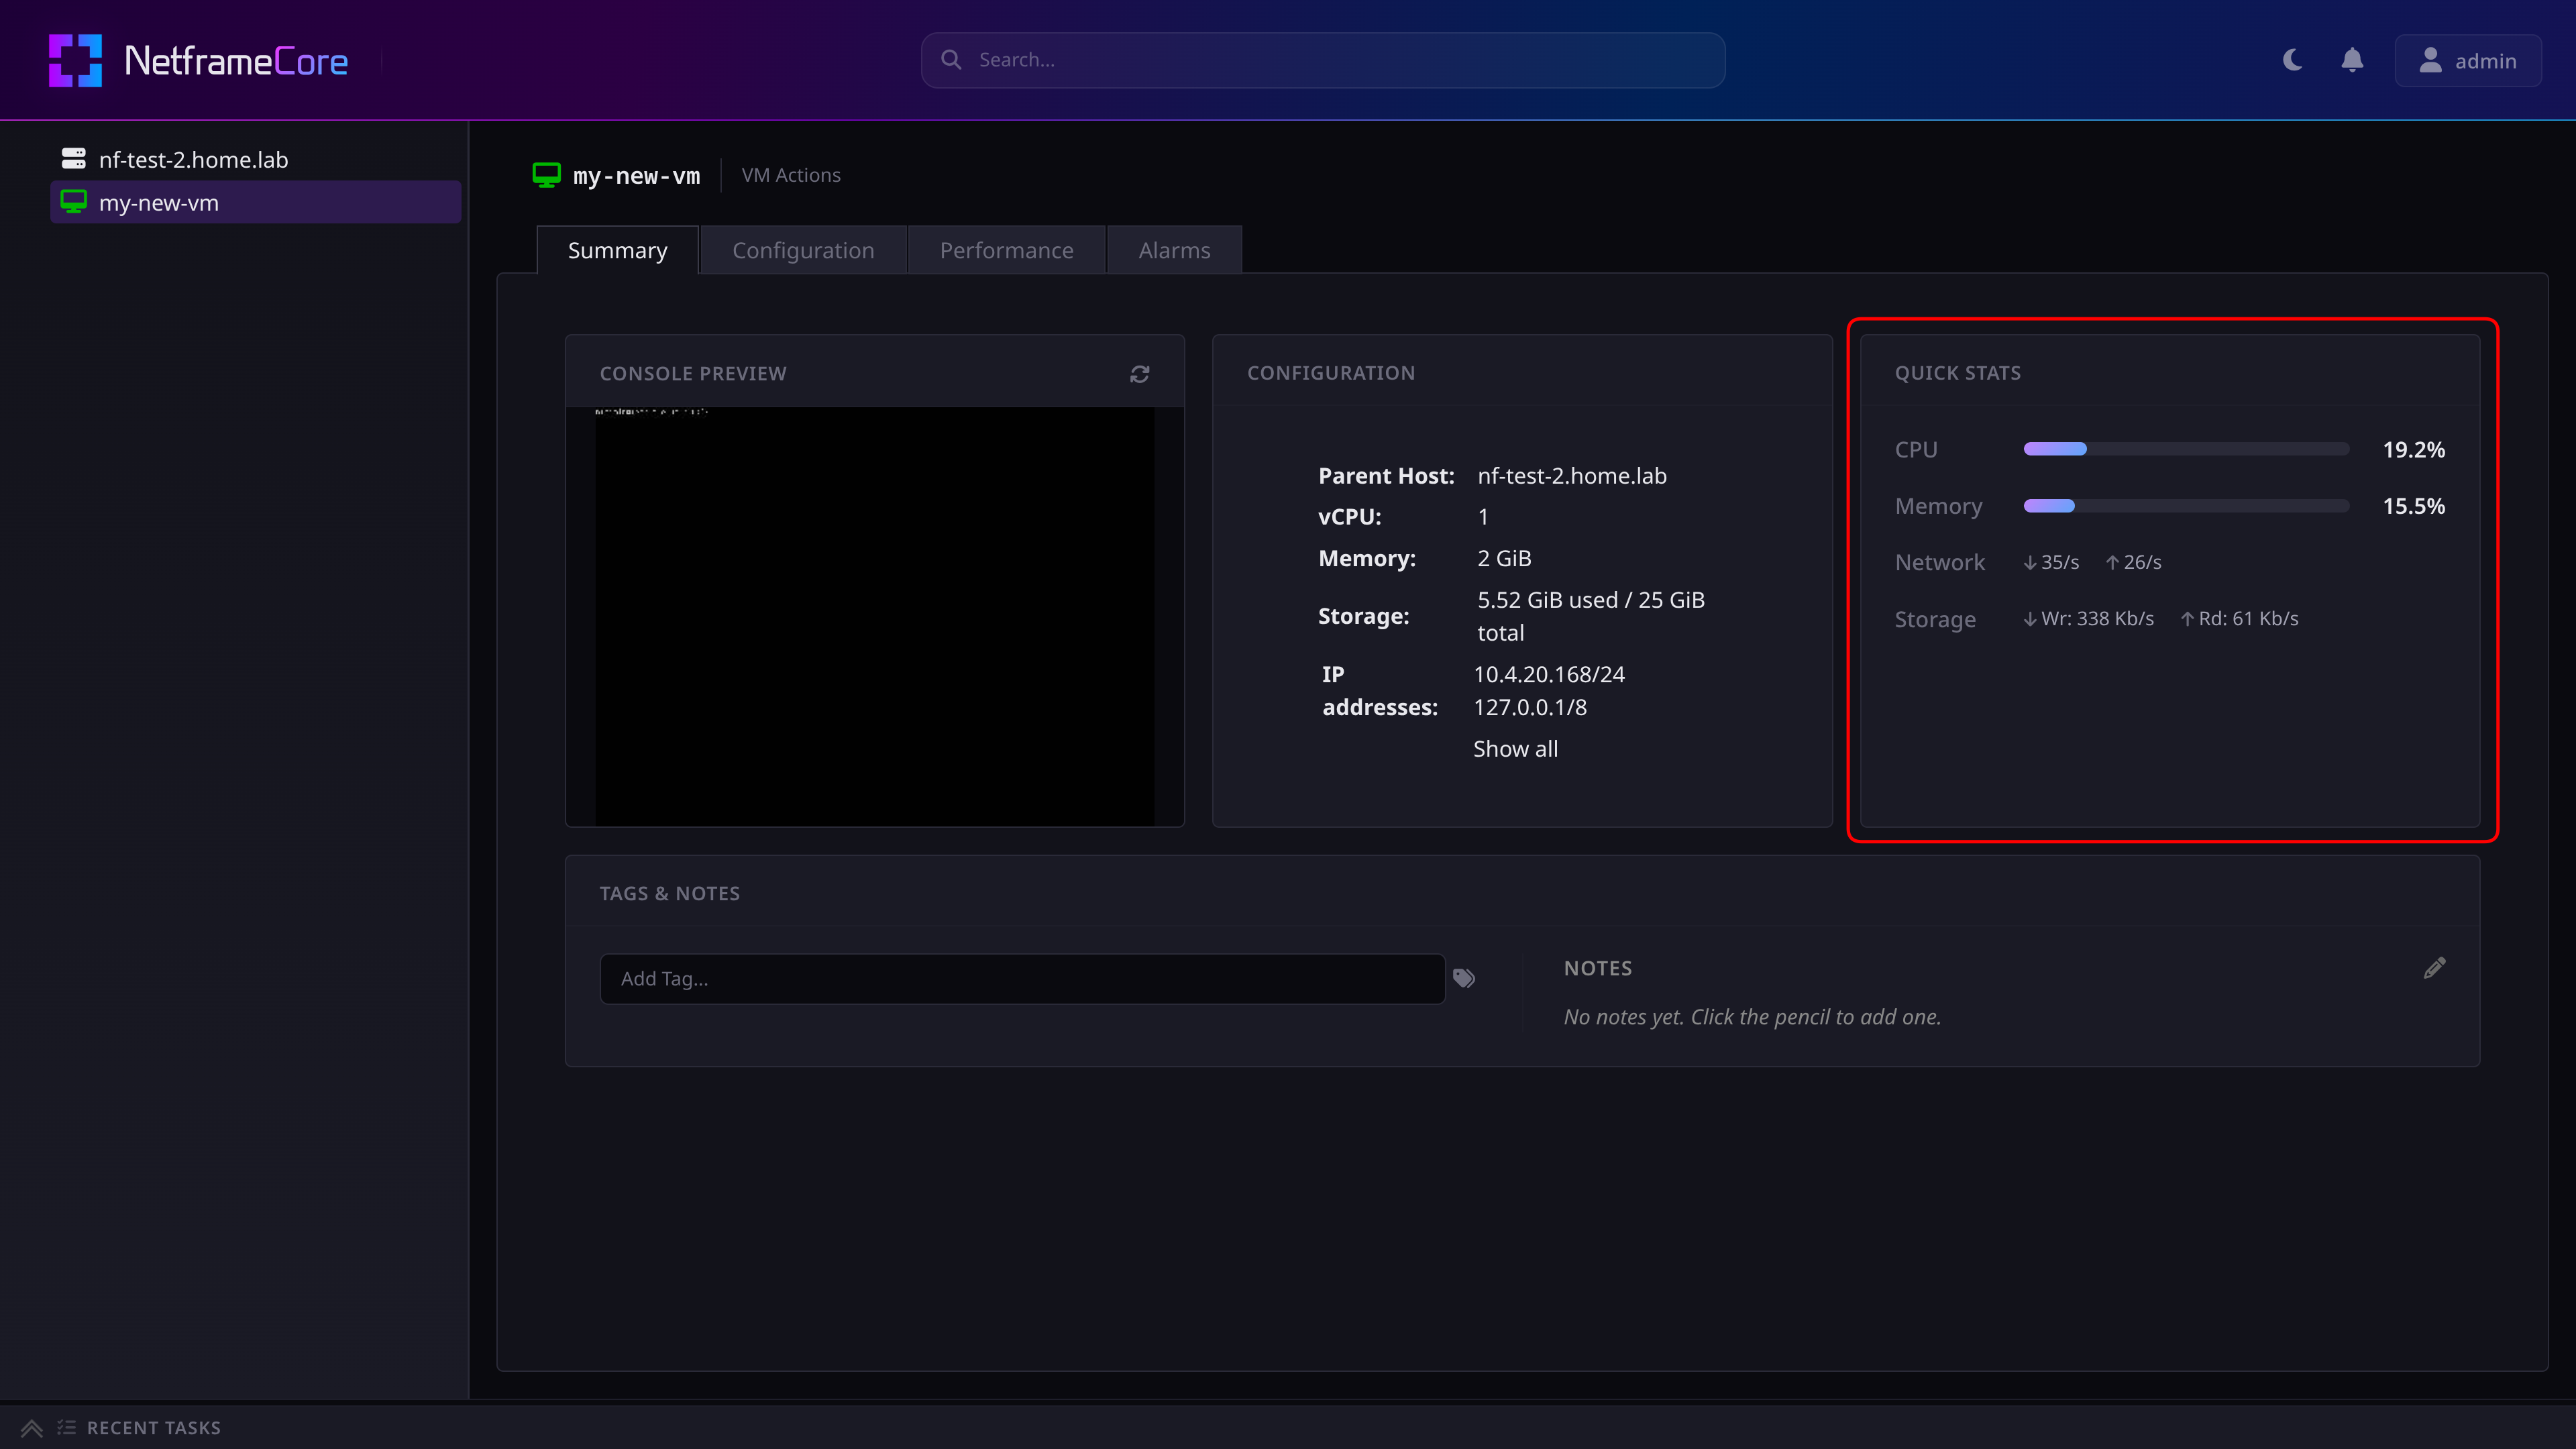
In Netframe, the Summary page for each VM and the Host will show some immediate performance metrics
¶ Detailed Metrics
To view detailed metrics for the Host or a VM, navigate to the object's Performance tab. This will show an overview page with charts for each of the object's performance categories.
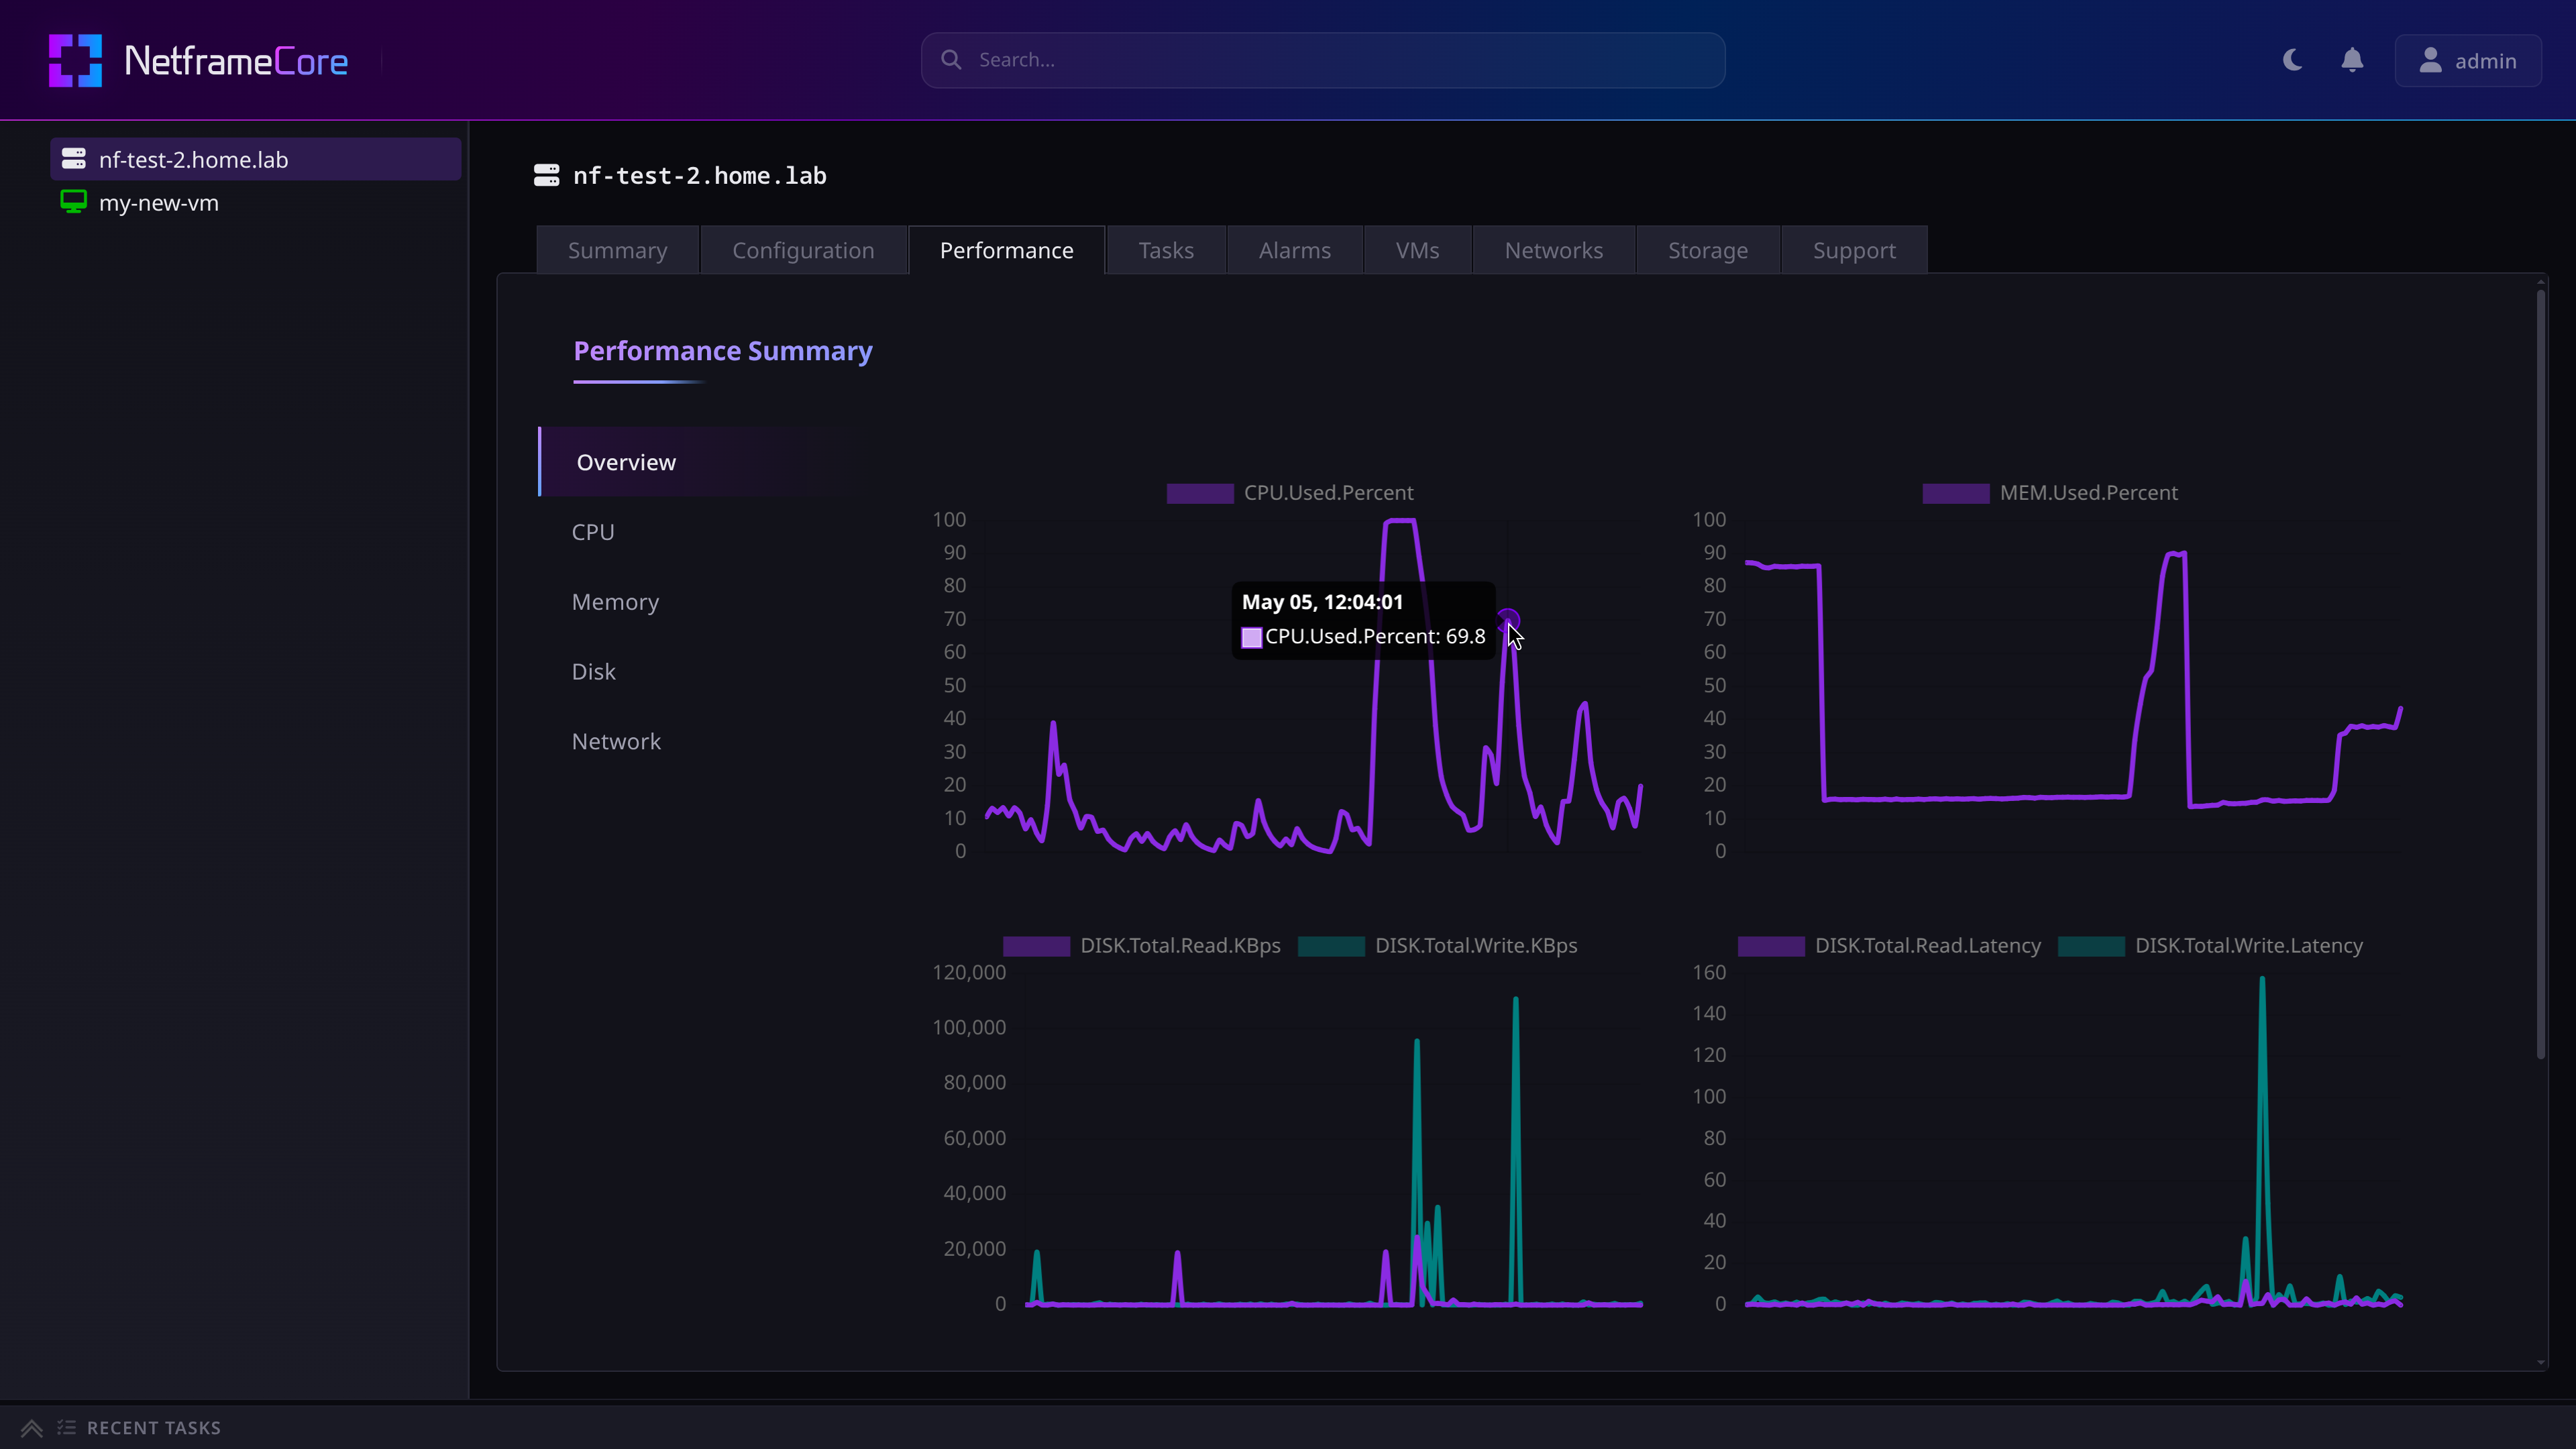
Hovering your cursor over a point on a graph will show more detailed information about the data point.
Opening one of the CPU, Memory, Disk, or Network tabs will give a more detailed chart in the respective category.
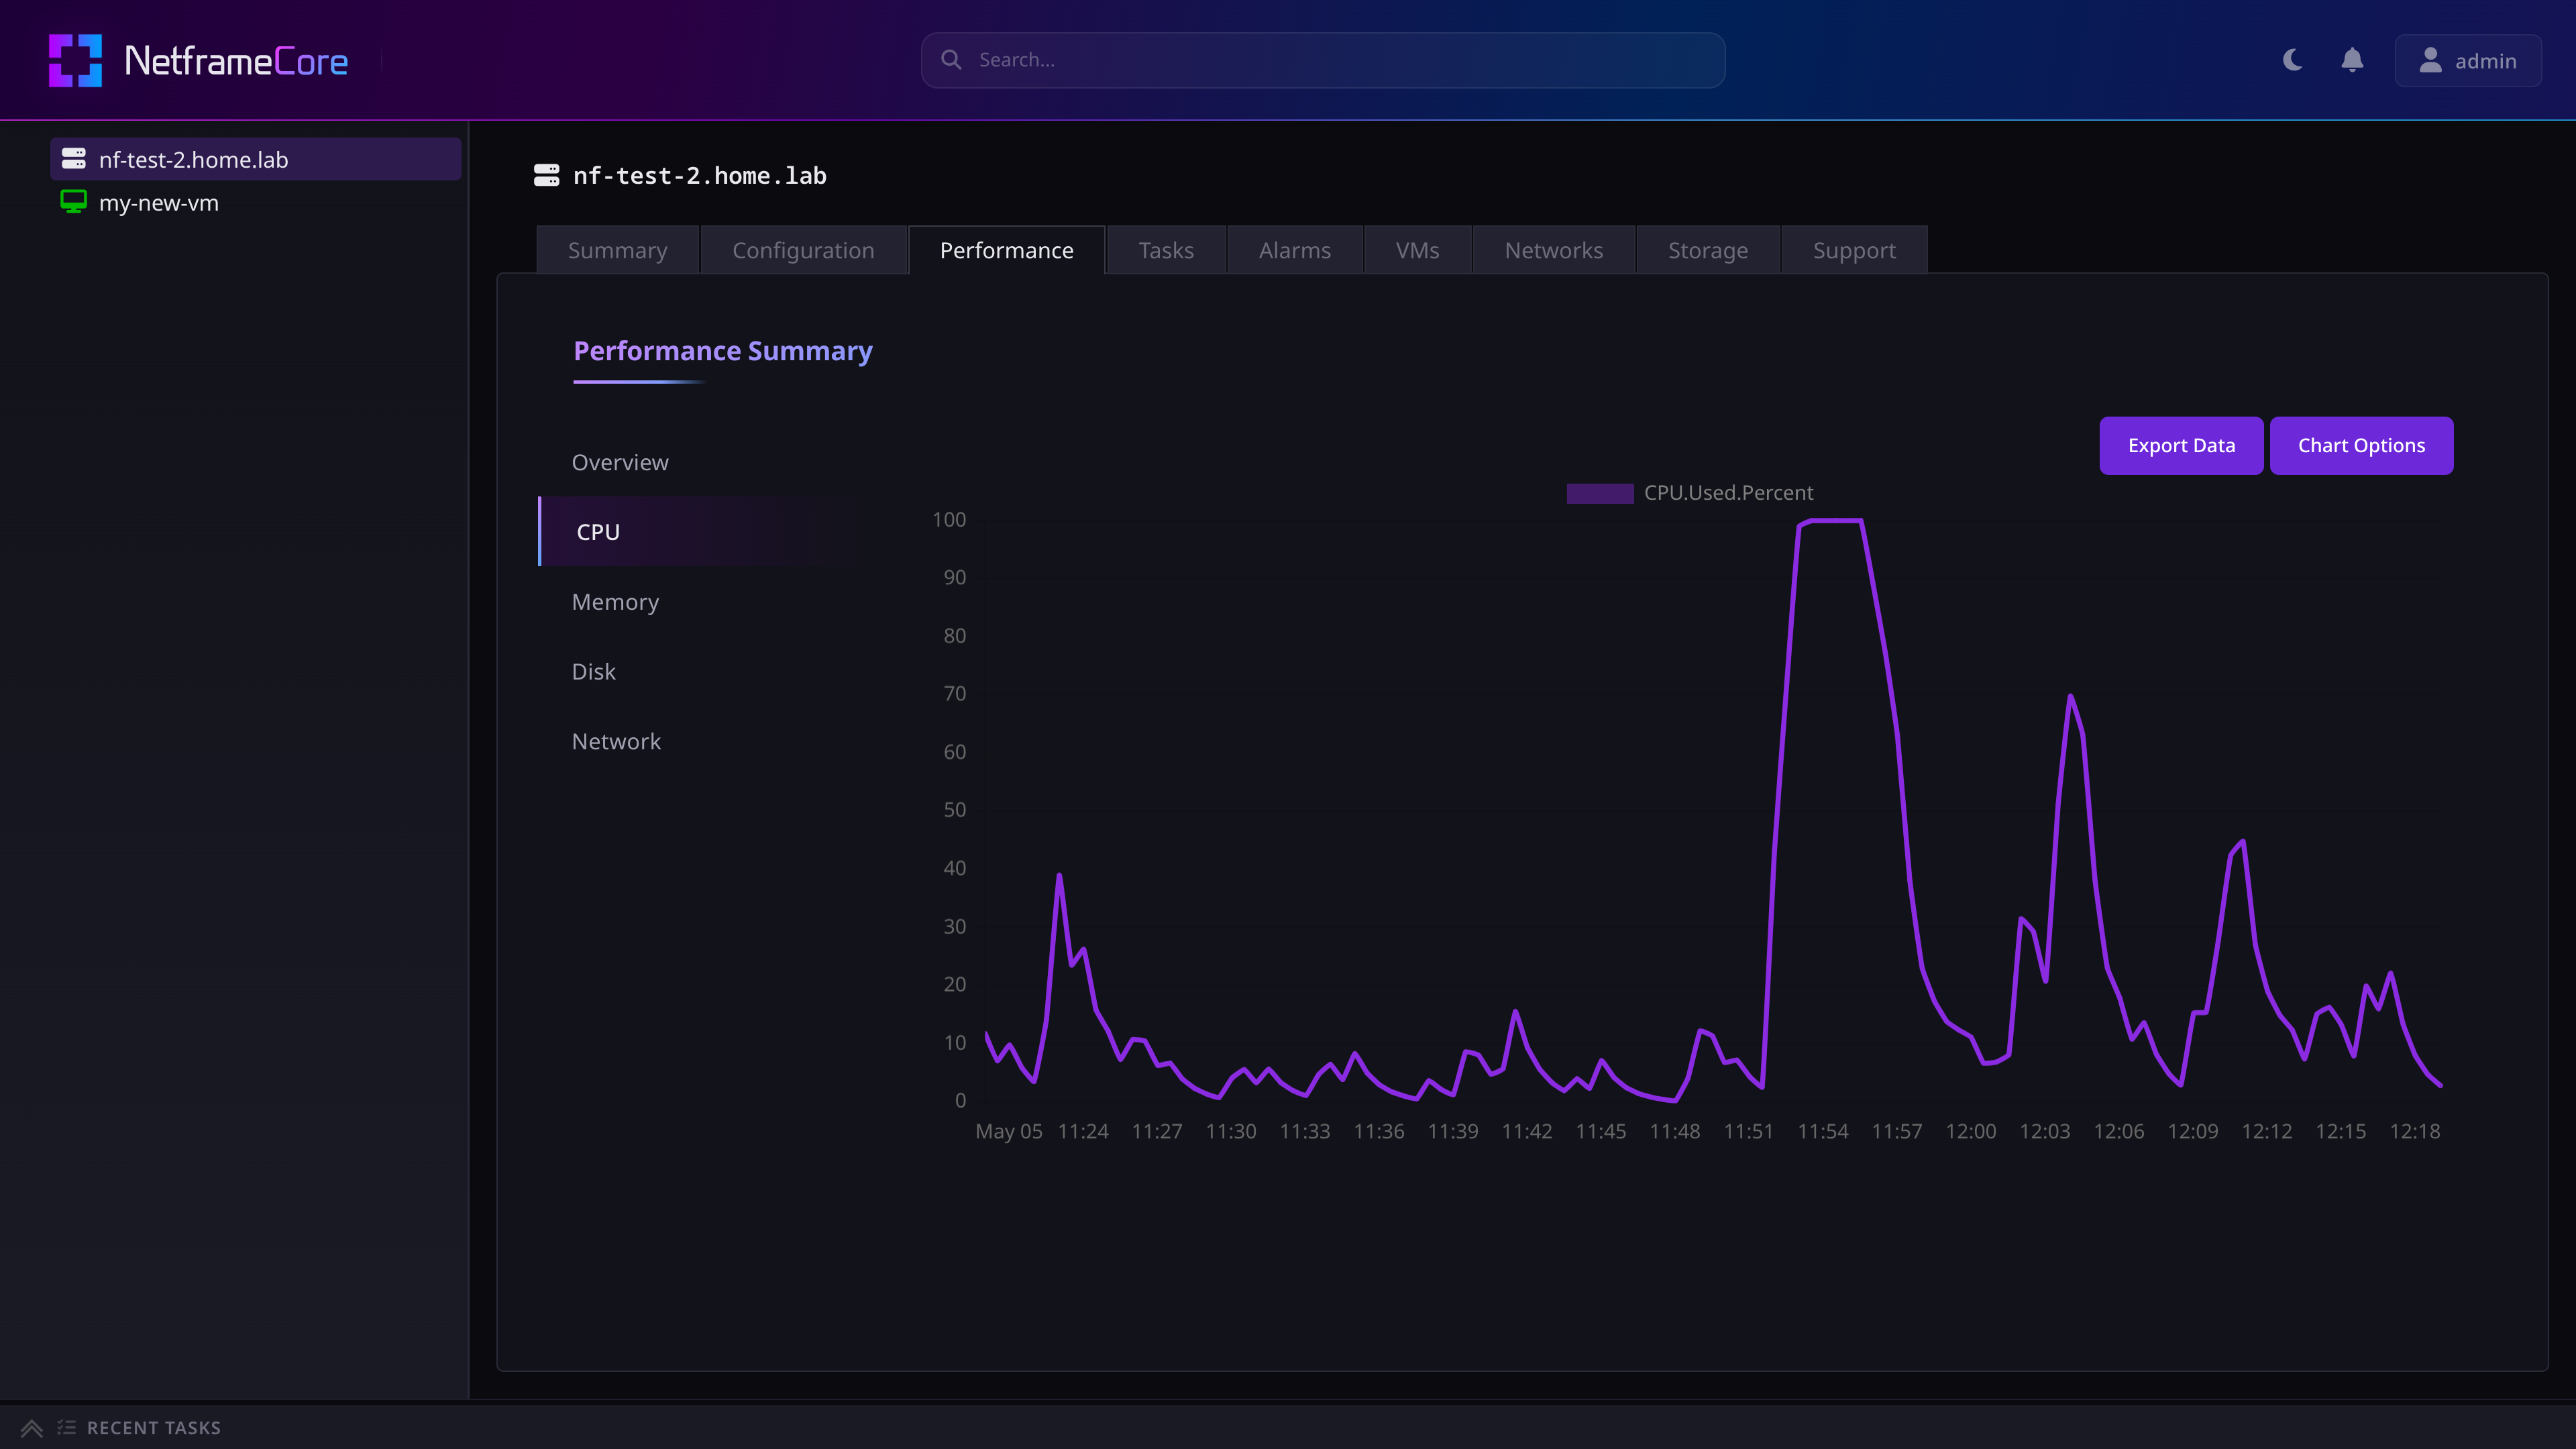
Here you can export the metric's data to a zip file containing CSVs for each metric shown.
Additionally, you can further customize what the chart shows by clicking on Chart Options:
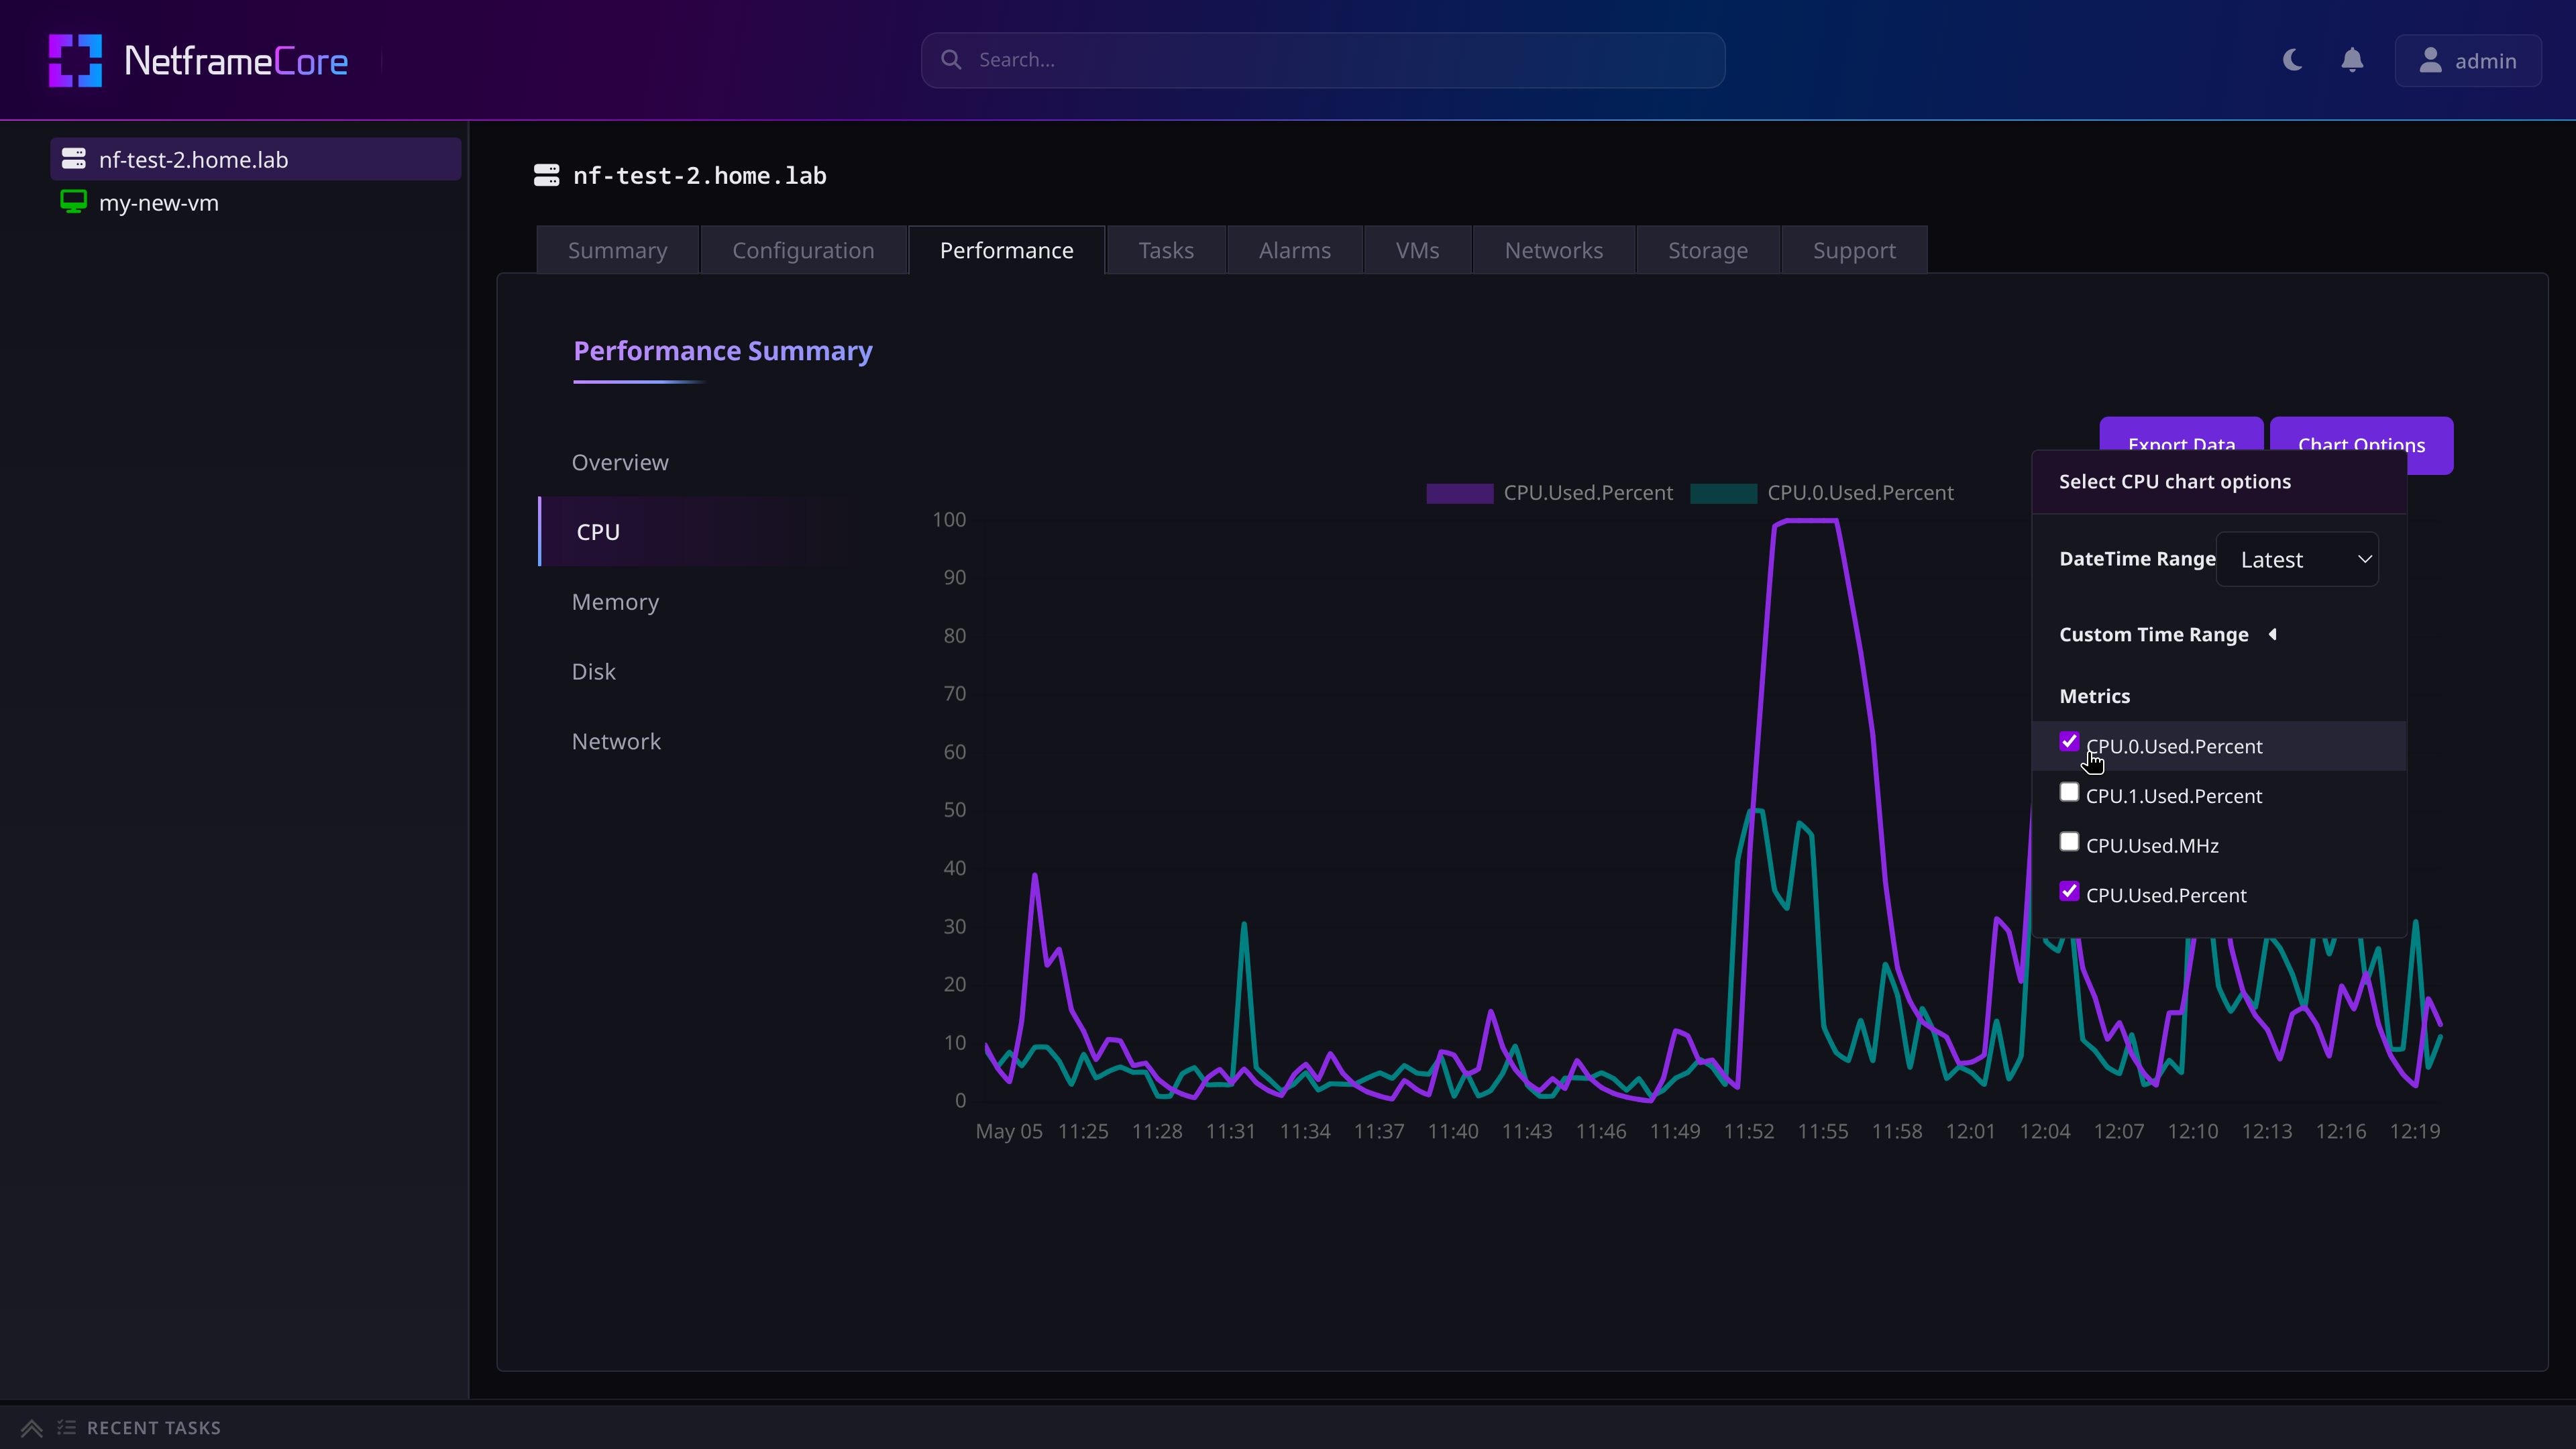
Here you can choose which metrics within the category are displayed on the chart, and customize the time range shown. The time range can either use a preset value, or can be changed to a custom range. The presets available are:
- Latest (1 hour)
- 8 hours
- 24 hours
- 3 days
- 7 days
- 30 days
¶ Alarms and Alerts
Alarms can be defined for a Host to notify you when specific events occur or performance thresholds at exceeded.
¶ Alarm definitions
To view and edit the alarm definitions, navigate to the Host's Alarms tab, and then go to the Alarm Definitions sub-tab.
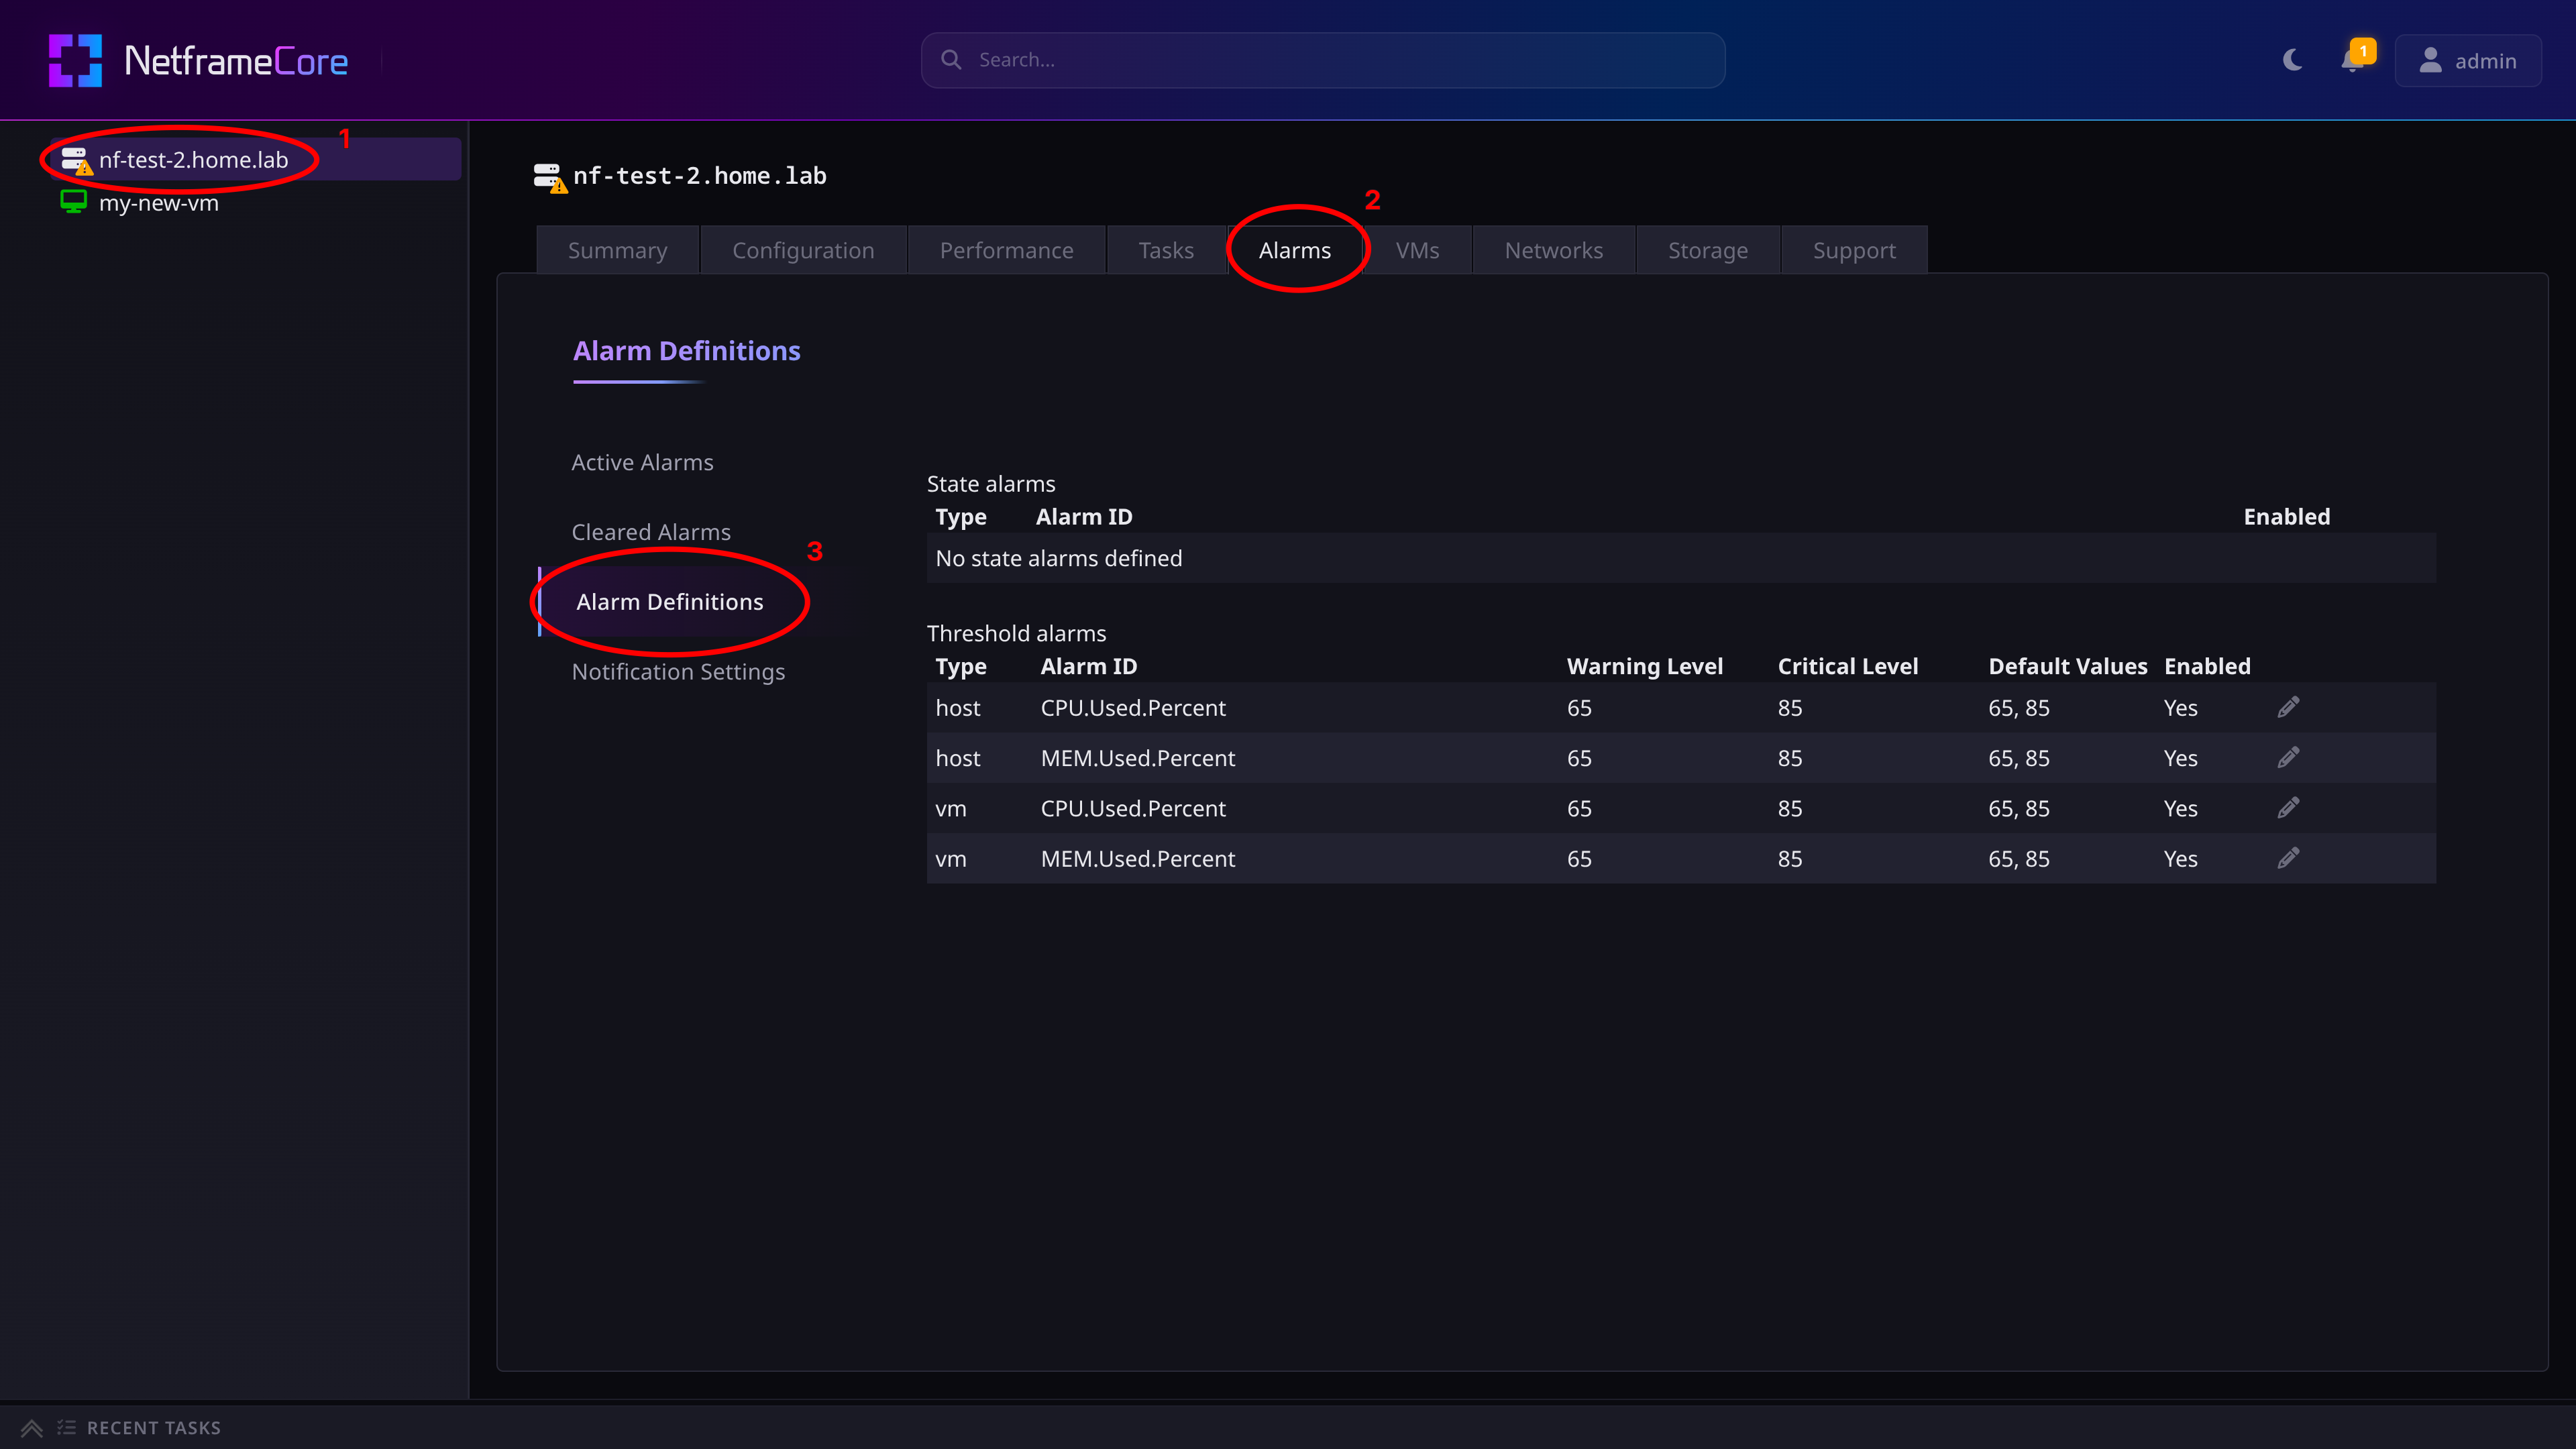
¶ Threshold alarms
Alarms are raised when CPU or memory usage exceeds the defined percentages. There are two ‘levels’ of alarms: Warning and Critical , with default thresholds of 65% and 85% respectively.
Thresholds can be set separately for the Host and for the VMs.
- Currently, there is no way to define threshold alarms for specific VMs in Netframe Core
- Per-VM overrides can however be set in Netframe Manager
¶ State alarms
Currently in development.
¶ Viewing active alarms
When an alarm has triggered, a warning symbol will show on the object that raised the alarm, and the bell/notification icon will show the number of alarms raised
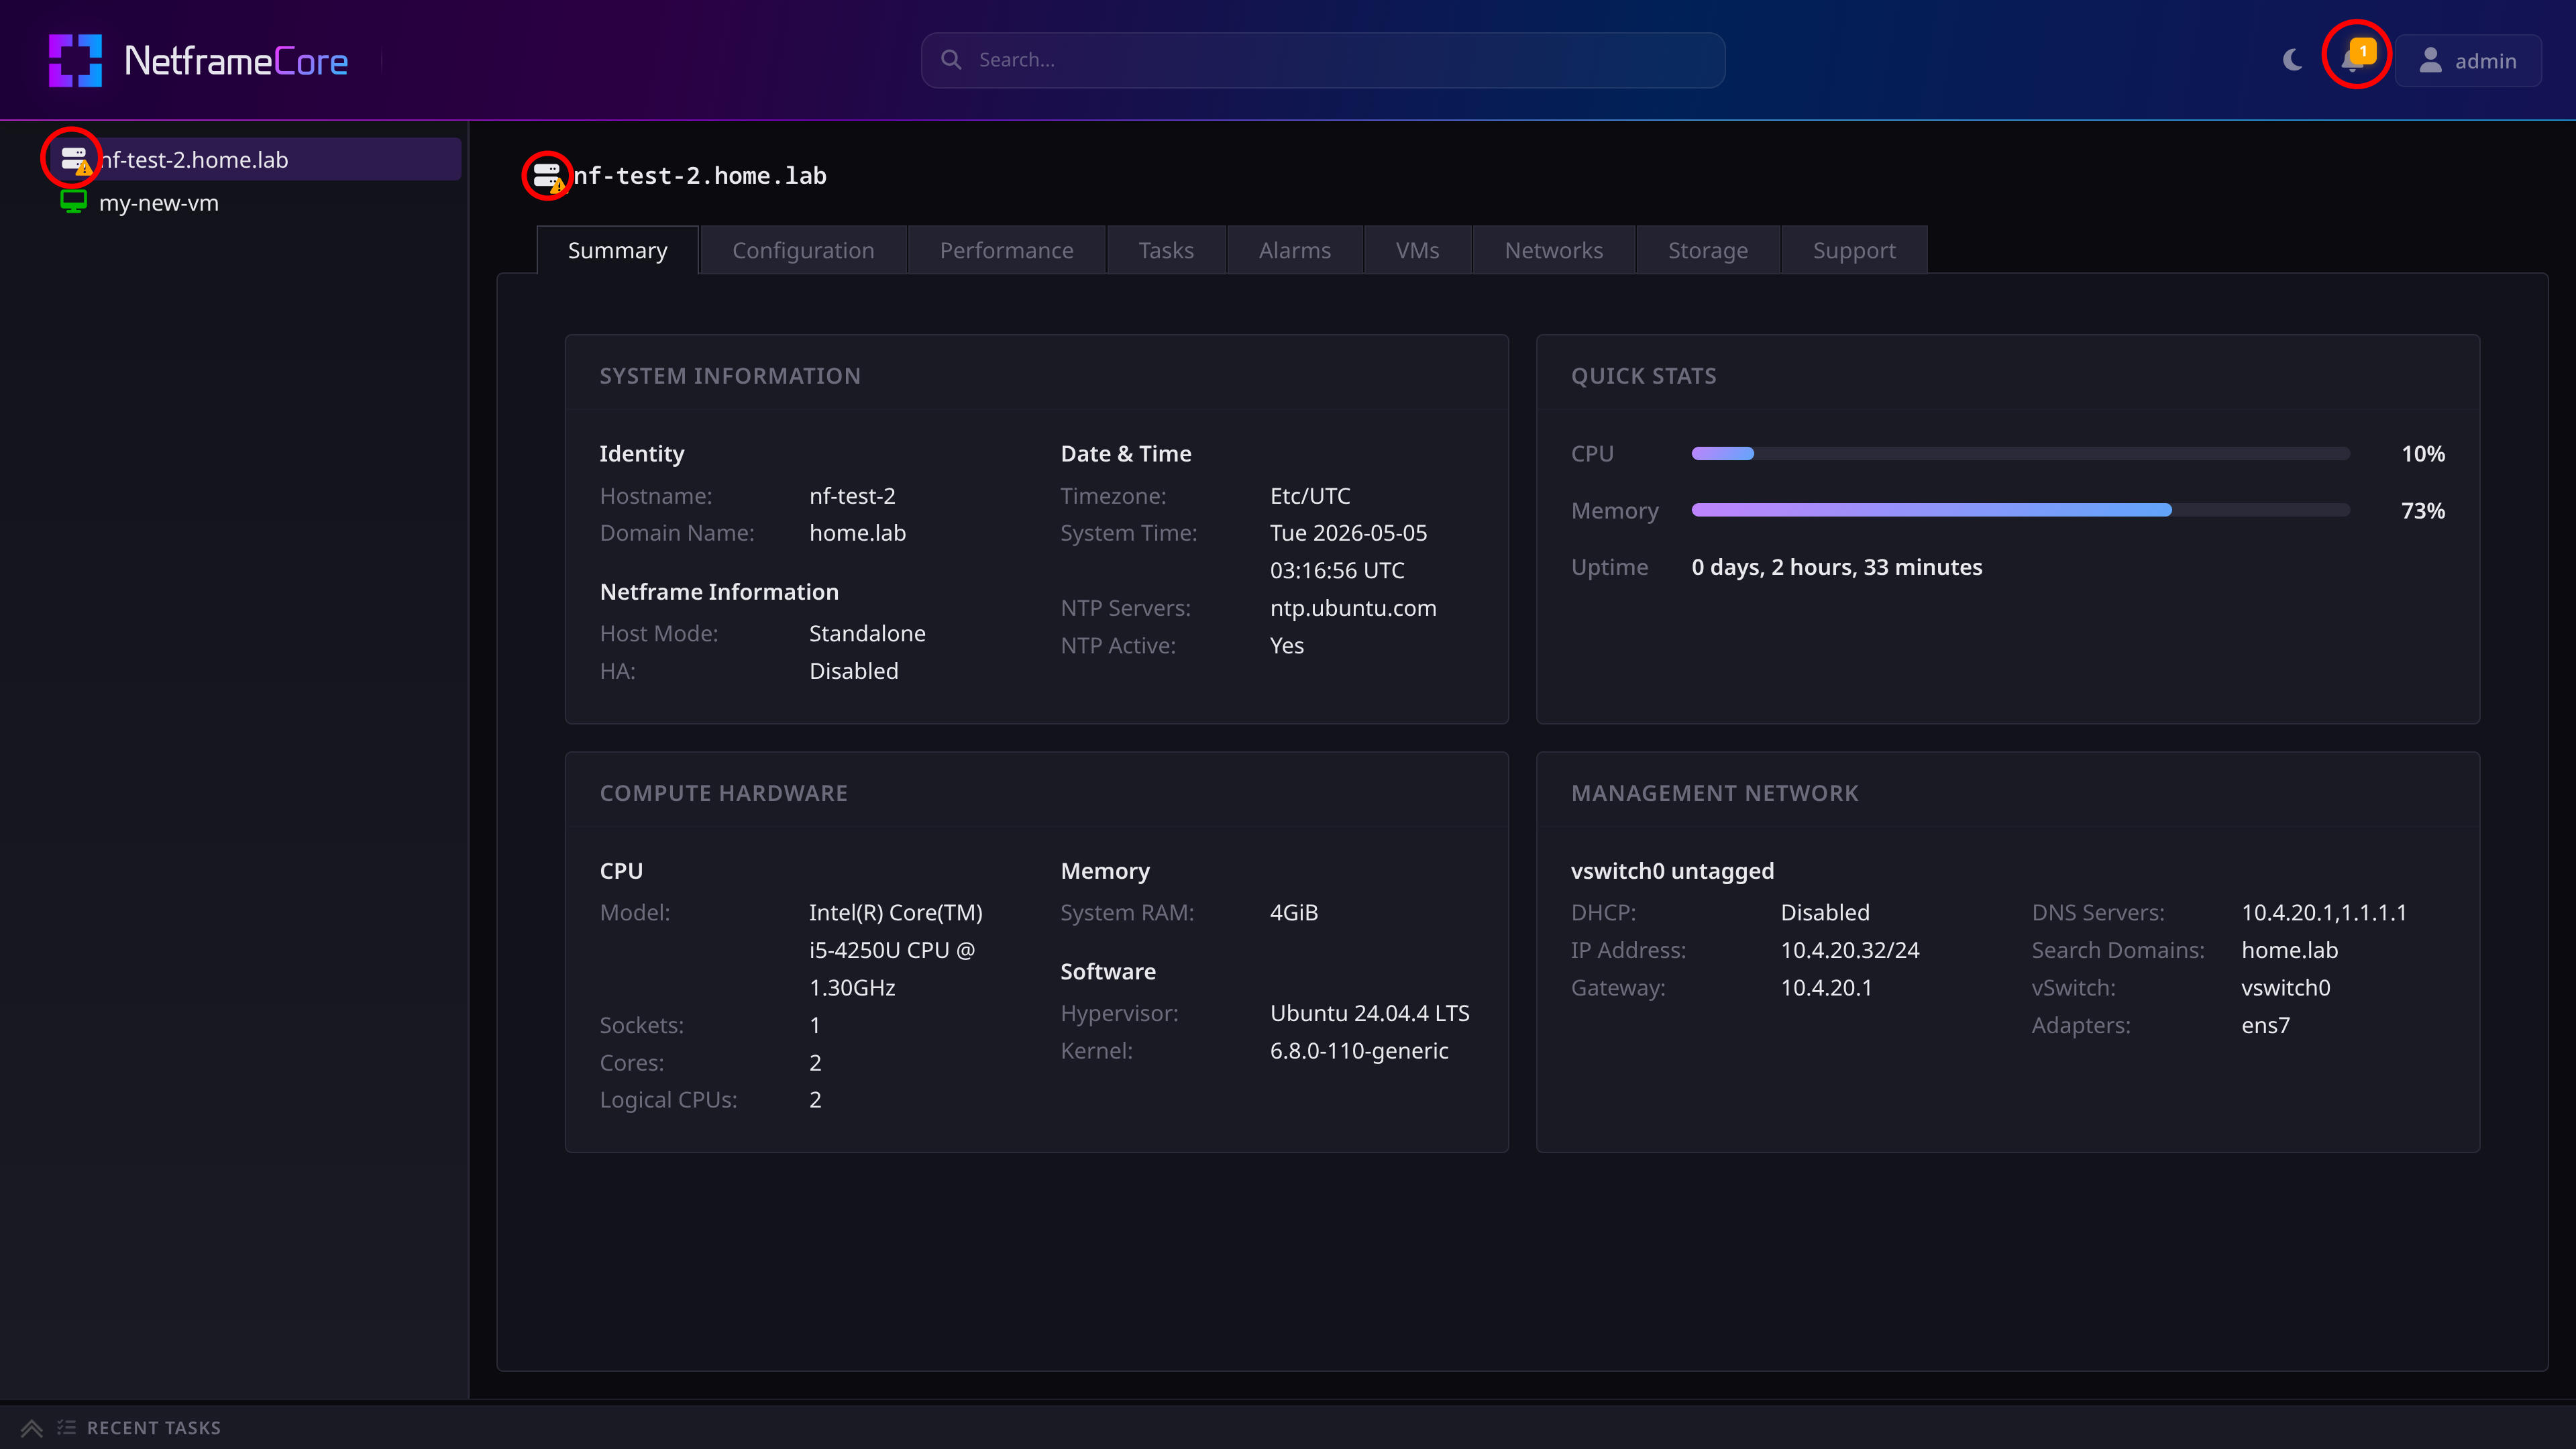
- Yellow symbols indicate that the
Warningthreshold has been met - Red symbols indicate that the
Criticalthreshold has been met
Clicking the bell icon will show which alarms have fired, and clicking on an alarm will take you to the alarming object's Alarms tab
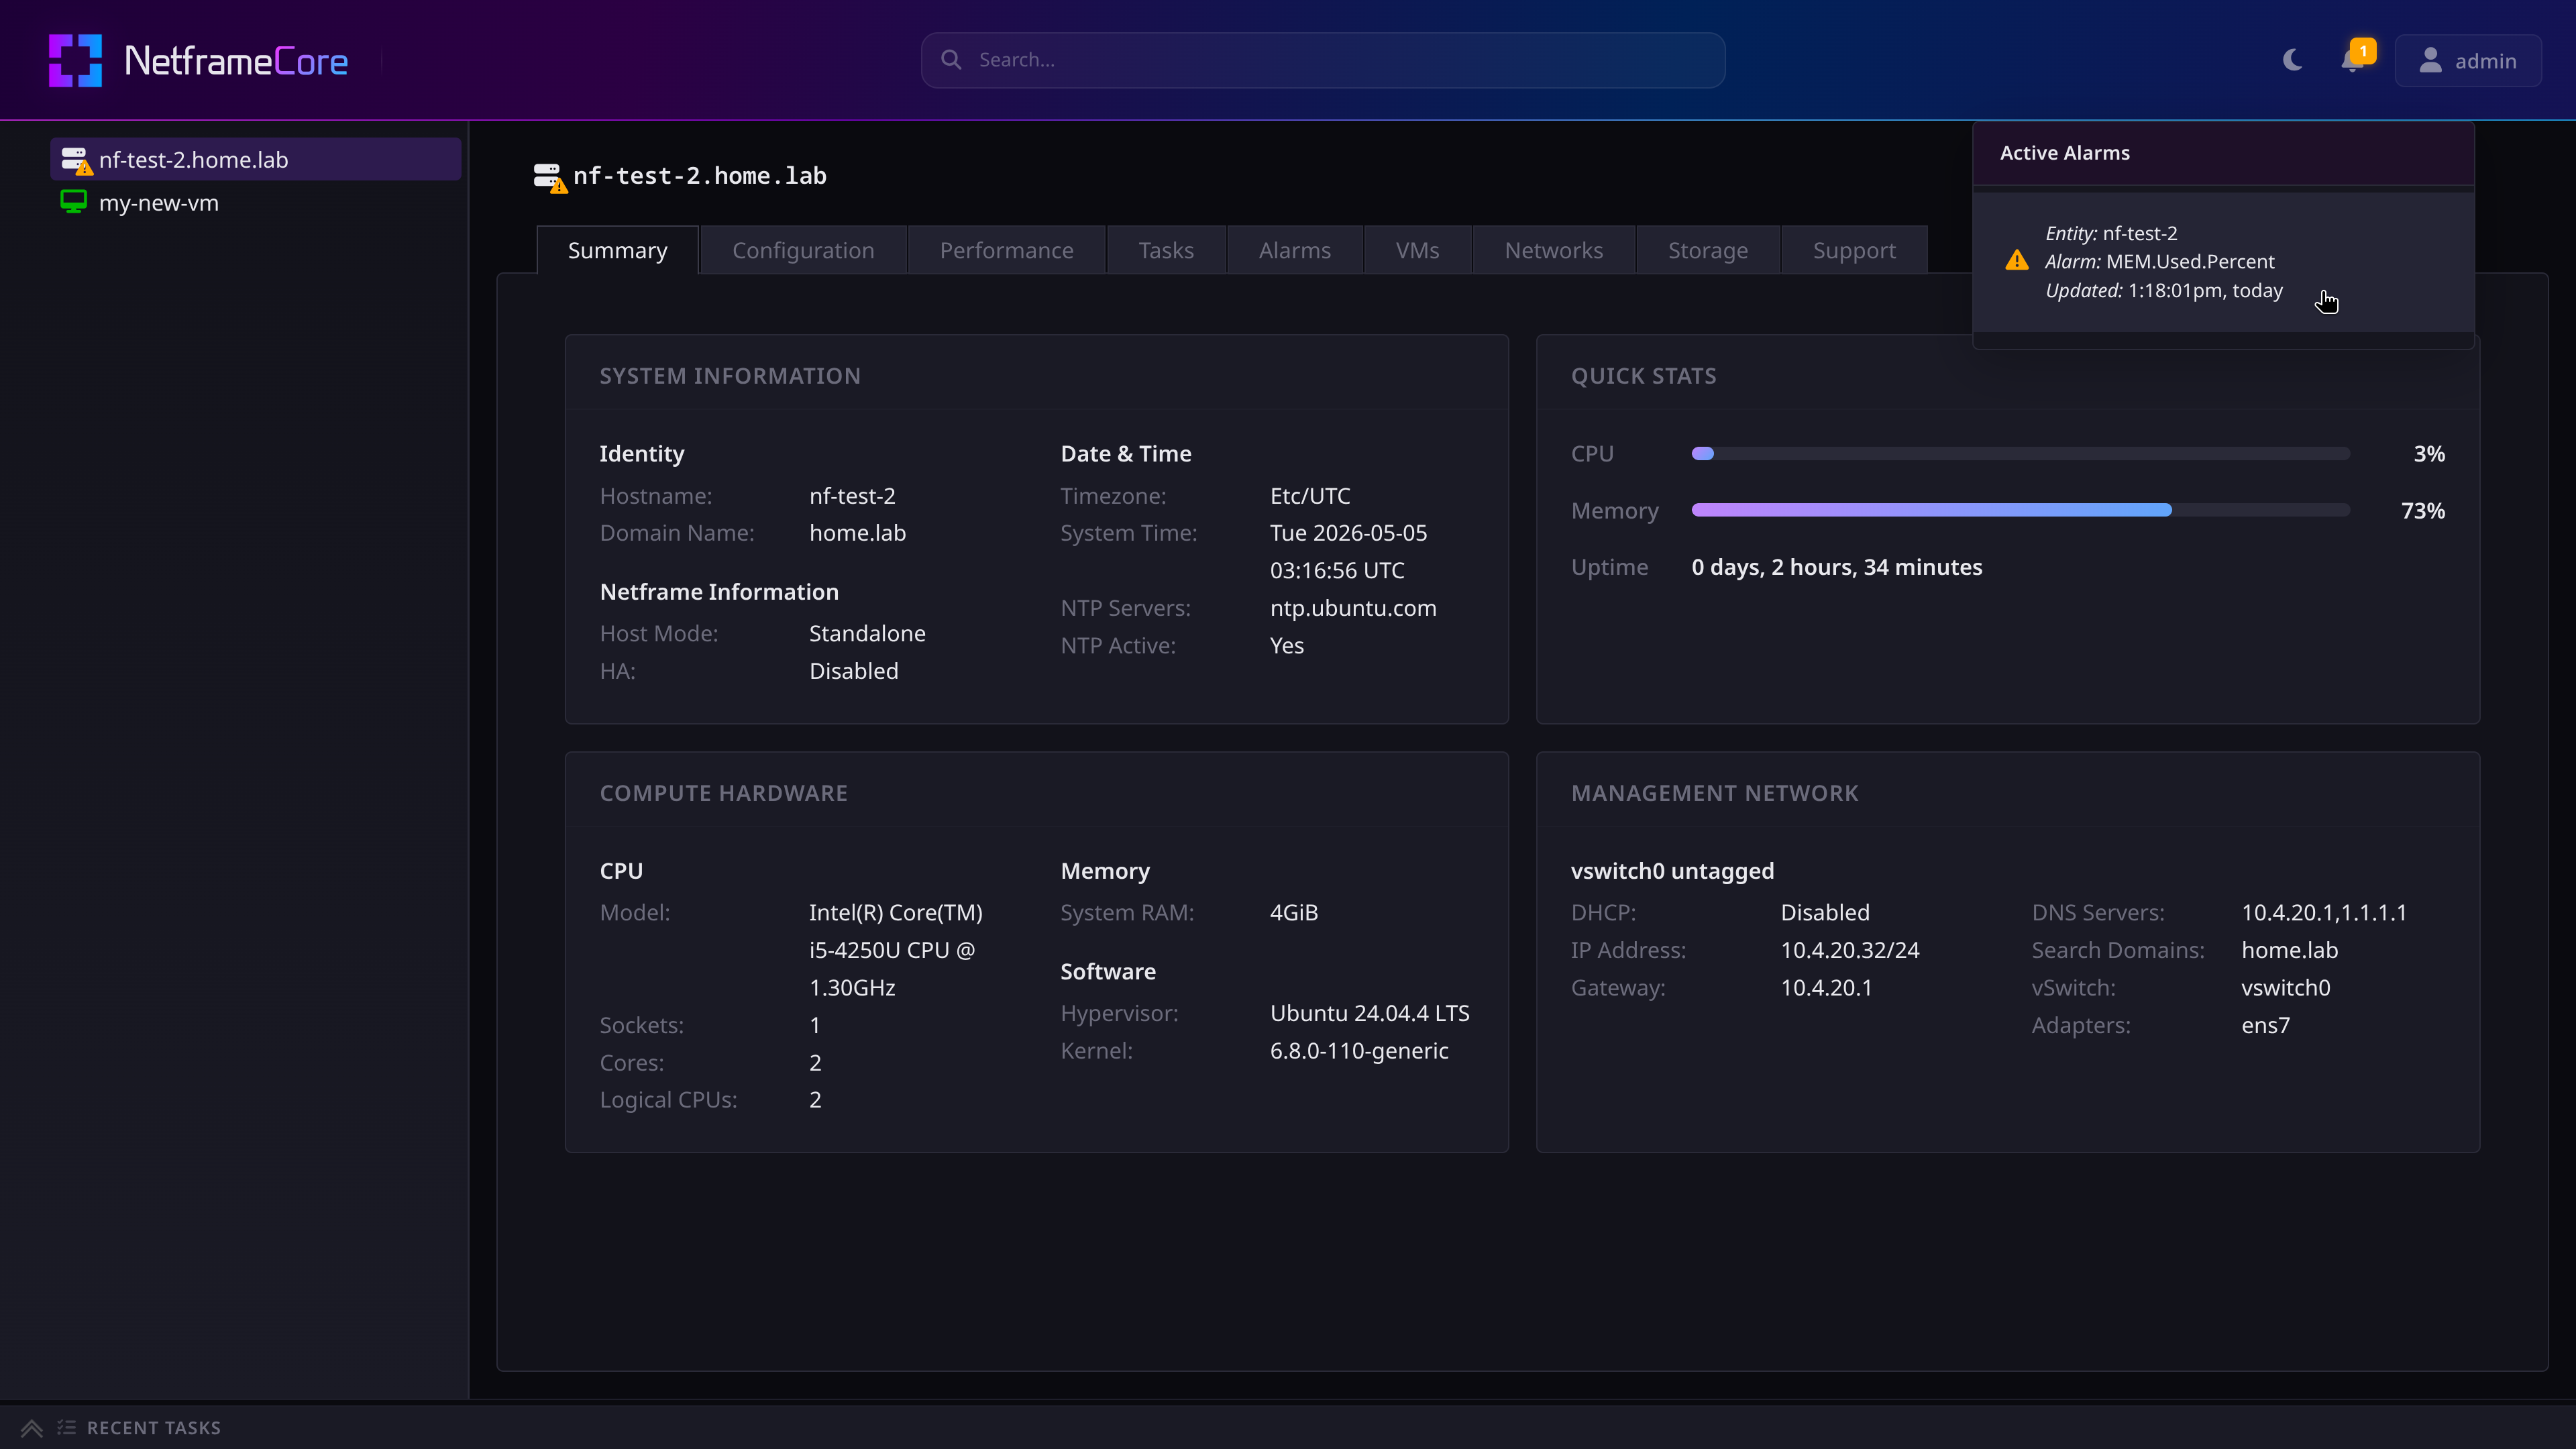
Here you can view all the currently active alarms on the Host or VM. By clicking on an alarm and pressing the Clear Alarm button, you can manually clear it.
¶ Configuring Notifications
TBA